InSAR — Measuring The Changing Shape of Our Earth From Above 🛰

Measuring The Changing Shape of Our Earth From Above
What is InSAR?

In — Interferometric: Satellite signals interact
S — Synthetic: Pretend you have a really long antenna
A — Aperture
R — Radar: Emits microwaves and measures echoes
InSAR is a remote sensing geodetic technique for measuring changes in topography and surface deformation. It is a way for scientists to track our constantly changing Earth without physically visiting a location. This means scientists have access to hard-to-reach and hazardous areas, as well as regions too big to study effectively on foot.
Earth Processes We Can Study With InSAR

Volcanic Movement
Ice Conditions
Earthquakes, Landslides
Ground Subsidence
Fluid Extraction
Glacier Motion
The InSAR technique results in a map of surface change known as an interferogram.
An interferogram shows the difference in the distance a signal traveled from two different satellite passes.
Why do we need two satellite passes?
Since an interferogram shows a change in the ground’s shape, we need a picture of the ground taken by the satellite before the surface deforms and another picture taken of the same location after the ground deforms.

What is the satellite measuring in each picture?
The satellite pictures are of “phase” and “amplitude.” Satellite signals oscillate back and forth. When a signal oscillates back to its starting point, this is one cycle. Any point within one cycle is called the Phase of the signal. Amplitude is how far the signal oscillates from its average value. A satellite constructs its Picture based on how far into a cycle the signal is when it hits the ground and returns to the satellite.

Phase component — Used for interferogram
Amplitude component — Used for georeferencing
What does a change in the ground look like?
If the ground moved between taking the pictures, the same location on both pictures Will have different phase values. Differencing the values produces an interferogram, where changes in Earth’s surface appear as color fringes.
What are color fringes?
Think of a fringe as color bands in the visible spectrum — one fringe includes all bands from purple to red.

How to read an Interferogram?
Wolf Volcano, Galápagos Islands, Ecuador
May 6, 2015, June 23, 2015

1 Pick your first fringe.
Choose a fringe where bands of color start looking consistent near the area of interest.
This is typically an automated process.
2 Did the surface move up or down?
Moving in the direction of increasingly tighter bands of color, note whether the pattern goes through the full color spectrum, from purple to red (surface moved away from the satellite) or red to purple (surface moved toward it).
Here the pattern goes from purple to red, meaning the ground moved away from the satellite — or down,
3 By how much?
Count the number of fringes. Multiply this number by the color scale at the bottom of the interferogram.
There are about 7 1/3 fringes. The scale ranges from 0 to 3 cm, giving 21–23 cm Of motion at the crater.
4 Interpret
The interferogram shows the ground around Wolf Volcano moved down (away
from the satellite) about 22 cm sometime between May 6 and June 23, 2015. The volcano erupted on May 25, suggesting this is deflation associated with the eruption.
Modeling of these data can yield information about the depth and dynamics Of the magmatic system.
Color Sequence
Deflation: Ground is moving away from satellite
Inflation: Ground is moving toward satellite
Sentinel-IA Path 128 Tops MCMC

How We Use lnSAR To Study Our Earth
Use this key to practice reading these interferograms from around the world.

Subsidence
Palm Springs, California, 2007 to 2011
The Palm Springs, California region has subsided approximately 7–10 cm over a four-year period (2007 to 2011) due to groundwater pumping in the Coachella Valley.

Ice Velocity
Greenland, 2007 2008
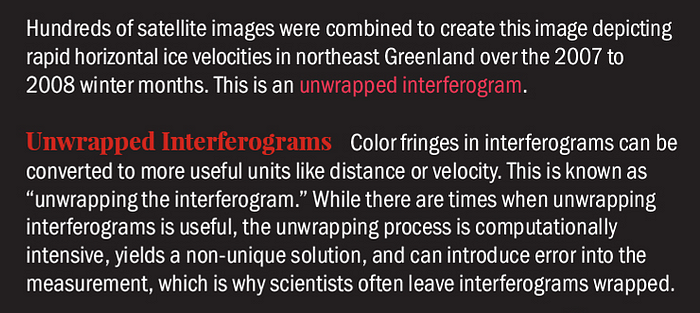
Hundreds of satellite images were combined to create this image depicting rapid horizontal ice velocities in northeast Greenland over the 2007 to 2008 winter months. This is an unwrapped interferogram.

Unwrapped interferograms
Color fringes in interferograms can be converted to more useful units like distance or velocity. This is known as “unwrapping the interferogram.” While there are times when unwrapping interferograms is useful, the unwrapping is computationally intensive, yields a non-unique solution, and can introduce error into the measurement, which is why scientists often leave interferograms wrapped.
Volcano Inflation
Big Island, Hawaii, November 15, 2014, to July 25, 2015
Within a perm of 8 months, ground around both Mauna Loa and Kilauea moved towards the satellite, indicating inflation. The centers of Mauna Loa and Kilauea both rose by about 12 cm.

Earthquake
MW- 78, Nepal, April 25, 2015
The 2015 Nepal earthquake was the result of thrust faulting between the Indian plate to the South and the Eurasian plate to its north.
The interferogram indicates the land on the southern side of the fault moved up and the land on the northern side moved down.
The earthquake produced two opposite motions, creating two set of fringes.
This area moved away from the satellite, thus the land moved downwards. There are approximately 7 fringes, totaling 80 cm.
The movement for this area was toward the satellite; the land moved upwards. There are approximately 9 fringes totaling ¯ 104 cm upward displacement.

Earthquake
Ms 6.7, China, November 11, 2016
The 2016 Akto earthquake near Xinjiang, China, occurred along a strike-slip fault.
The land South of the fault moved to the west, while the land north of the fault moved to the east. Total motion amounted to about 12 cm at the surface of this blind fault, with about 1 meter of slip at depth.
One fringe indicates motion of this region away from the satellite by about 3 cm.
interferograms of strike-slip earthquakes typically show a “butterfly” pattern. Each quadrant where the land is either compressing or expanding during the earthquake appears as one lobe of the butterfly.
Three fringes indicate motion of this region toward the satellite by about 9 cm.

How Does InSAR Detect Changes in The Landscape?
Multiple satellite passes are needed to measure changes.
Example of InSAR detecting change (Earthquake)
Satellite Pass #1 — Pre-deformation
- SAR satellite emits microwave signal (red line)
- Signal bounces off surface and returns to SAR satellite along line-of-sight path

Satellite Pass #2 — Post-deformation
3. After a deformation event, SAR satellite passes over the same spot.
4. SAR satellite emits microwave signal. (red line)
5. Change in signal (blue line) yields ground movement.

What Do We Already Know?
- Location of satellite during both passes
- Speed of light
What Do We Need to Know?
- Phase of the return signal for both satellite passes
- Local topography and atmospheric conditions at time of measurement
So, Now What?
- After measuring the Phase for both satellite passes, and applying any
corrections, subtract the difference in Phase to create an interferogram
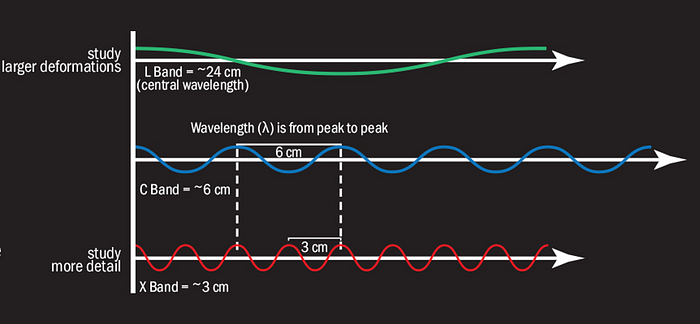
Different SAR satellites emit different microwave wavelengths, providing different levels of detail.

SAR satellites use microwaves because they are less affected by our
atmosphere compared to waves of other frequencies.
- All SAR satellites operate in the microwave band, but different satellites use different wavelengths: — 24 cm (e.g., ALOS-2) 6 cm (e.g., Sentinel-1B), and — 3 cm
(e.g., TerraSAR-X) - Shorter wavelengths reveal more detail, Longer wavelengths allow measurement of larger surface deformations
- Vegetation and geology Will affect what wavelength you use to study the feature of interest
Source: